Exercise 14.1
1. A survey was conducted by a group of students as a part of their environment awareness program, in which they collected the following data regarding the number of plants in 20 houses in a locality. Find the mean number of plants per house. Number of Plants 0-2 2-4 4-6 6-8 8-10 10-12 12-14 Number of Houses 1 2 1 5 6 2 3 Which method did you use for finding the mean, and why?
Solution: In order to find the mean value, we will use direct method because the numerical value of fiand xiare small. Find the midpoint of the given interval using the formula. Midpoint (xi) = (upper limit + lower limit)/2 No. of plants (Class interval) No. of houses Frequency (fi) Mid-point (xi) fixi 0-2 1 1 1 2-4 2 3 6 4-6 1 5 5 6-8 5 7 35 8-10 6 9 54 10-12 2 11 22 12-14 3 13 39
Sum fi= 20
Sum fixi= 162 The formula to find the mean is: Mean = x̄ = ∑fixi/∑fi = 162/20 = 8.1
Therefore, the mean number of plants per house is 8.1
2. Consider the following distribution of daily wages of 50 workers of a factory. Daily wages (in Rs.) 100-120 120-140 140-160 160-180 180-200 Number of workers 12 14 8 6 10 Find the mean daily wages of the workers of the factory by using an appropriate method.
Solution: Find the midpoint of the given interval using the formula. Midpoint (xi) = (upper limit + lower limit)/2 In this case, the value of mid-point (xi) is very large, so let us assume the mean value, A = 150 and class interval is h = 20. So, ui= (xi– A)/h = ui = (xi– 150)/20 Substitute and find the values as follows: Daily wages (Class interval) Number of workers frequency (fi) Mid-point (xi) ui= (xi– 150)/20 fiui 100-120 12 110 -2 -24 120-140 14 130 -1 -14 140-160 8 150 0 0 160-180 6 170 1 6 180-200 10 190 2 20 Total Sum fi= 50
Sum fiui= -12 So, the formula to find out the mean is: Mean = x̄ = A + h∑fiui/∑fi=150 + (20 × -12/50) = 150 – 4.8 = 145.20 Thus, mean daily wage of the workers = Rs. 145.20
3. The following distribution shows the daily pocket allowance of children of a locality. The mean pocket allowance is Rs 18. Find the missing frequency f. Daily Pocket Allowance(in c) 11-13 13-15 15-17 17-19 19-21 21-23 23-35 Number of children 7 6 9 13 f 5 4
Solution: To find out the missing frequency, use the mean formula. Here, the value of mid-point (xi) meanx̄= 18 Class interval Number of children (fi) Mid-point (xi) fixi 11-13 7 12 84 13-15 6 14 84 15-17 9 16 144 17-19 13 18 = A 234 19-21 f 20 20f 21-23 5 22 110 23-25 4 24 96 Total fi= 44+f
Sum fixi= 752+20f The mean formula is Mean = x̄ = ∑fixi/∑fi= (752+20f)/(44+f) Now substitute the values and equate to find the missing frequency (f) ⇒ 18 = (752+20f)/(44+f) ⇒ 18(44+f) = (752+20f) ⇒ 792+18f = 752+20f ⇒ 792+18f = 752+20f ⇒ 792 – 752 = 20f – 18f ⇒ 40 = 2f ⇒ f = 20 So, the missing frequency, f = 20.
4. Thirty women were examined in a hospital by a doctor and the number of heart beats per minute were recorded and summarized as follows. Find the mean heart beats per minute for these women, choosing a suitable method. Number of heart beats per minute 65-68 68-71 71-74 74-77 77-80 80-83 83-86 Number of women 2 4 3 8 7 4 2
Solution: From the given data, let us assume the mean as A = 75.5 xi= (Upper limit + Lower limit)/2 Class size (h) = 3 Now, find the uiand fiuias follows: Class Interval Number of women (fi) Mid-point (xi) ui= (xi– 75.5)/h fiui 65-68 2 66.5 -3 -6 68-71 4 69.5 -2 -8 71-74 3 72.5 -1 -3 74-77 8 75.5 0 0 77-80 7 78.5 1 7 80-83 4 81.5 3 8 83-86 2 84.5 3 6
Sum fi= 30
Sum fiui= 4 Mean = x̄ = A + h∑fiui/∑fi = 75.5 + 3×(4/30) = 75.5 + 4/10 = 75.5 + 0.4 = 75.9 Therefore, the mean heart beats per minute for these women is 75.9
5. In a retail market, fruit vendors were selling mangoes kept in packing boxes. These boxes contained varying number of mangoes. The following was the distribution of mangoes according to the number of boxes. Number of mangoes 50-52 53-55 56-58 59-61 62-64 Number of boxes 15 110 135 115 25 Find the mean number of mangoes kept in a packing box. Which method of finding the mean did you choose?
Solution: Since, the given data is not continuous so we add 0.5 to the upper limit and subtract 0.45 from the lower limit as the gap between two intervals are 1 Here, assumed mean (A) = 57 Class size (h) = 3 Here, the step deviation is used because the frequency values are big. Class Interval Number of boxes (fi) Mid-point (xi) di= xi– A fidi 49.5-52.5 15 51 -6 90 52.5-55.5 110 54 -3 -330 55.5-58.5 135 57 = A 0 0 58.5-61.5 115 60 3 345 61.5-64.5 25 63 6 150
Sum fi= 400
Sum fidi= 75 The formula to find out the Mean is: Mean = x̄ = A +h ∑fidi/∑fi = 57 + 3(75/400) = 57 + 0.1875 = 57.19 Therefore, the mean number of mangoes kept in a packing box is 57.19
6. The table below shows the daily expenditure on food of 25 households in a locality. Find the mean daily expenditure on food by a suitable method. Daily expenditure(in c) 100-150 150-200 200-250 250-300 300-350 Number of households 4 5 12 2 2
Solution: Find the midpoint of the given interval using the formula. Midpoint (xi) = (upper limit + lower limit)/2 Let is assume the mean (A) = 225 Class size (h) = 50 Class Interval Number of households (fi) Mid-point (xi) di= xi– A ui= di/50 fiui 100-150 4 125 -100 -2 -8 150-200 5 175 -50 -1 -5 200-250 12 225 0 0 0 250-300 2 275 50 1 2 300-350 2 325 100 2 4
Sum fi= 25
Sum fiui= -7 Mean = x̄ = A +h∑fiui/∑fi = 225+50(-7/25) = 225-14 = 211 Therefore, the mean daily expenditure on food is 211
7. To find out the concentration of SO2in the air (in parts per million, i.e., ppm), the data was collected for 30 localities in a certain city and is presented below: Concentration of SO2( in ppm) Frequency 0.00 – 0.04 4 0.04 – 0.08 9 0.08 – 0.12 9 0.12 – 0.16 2 0.16 – 0.20 4 0.20 – 0.24 2 Find the mean concentration of SO2in the air.
Solution: To find out the mean, first find the midpoint of the given frequencies as follows: Concentration of SO2(in ppm) Frequency (fi) Mid-point (xi) fixi 0.00-0.04 4 0.02 0.08 0.04-0.08 9 0.06 0.54 0.08-0.12 9 0.10 0.90 0.12-0.16 2 0.14 0.28 0.16-0.20 4 0.18 0.72 0.20-0.24 2 0.20 0.40 Total Sum fi= 30
Sum (fixi) = 2.96 The formula to find out the mean is Mean = x̄ = ∑fixi/∑fi = 2.96/30 = 0.099 ppm Therefore, the mean concentration of SO2in air is 0.099 ppm.
8. A class teacher has the following absentee record of 40 students of a class for the whole term. Find the mean number of days a student was absent. Number of days 0-6 6-10 10-14 14-20 20-28 28-38 38-40 Number of students 11 10 7 4 4 3 1
Solution: Find the midpoint of the given interval using the formula. Midpoint (xi) = (upper limit + lower limit)/2 Class interval Frequency (fi) Mid-point (xi) fixi 0-6 11 3 33 6-10 10 8 80 10-14 7 12 84 14-20 4 17 68 20-28 4 24 96 28-38 3 33 99 38-40 1 39 39
Sumfi= 40
Sumfixi= 499 The mean formula is, Mean = x̄ = ∑fixi/∑fi = 499/40 = 12.48 days Therefore, the mean number of days a student was absent = 12.48.
9. The following table gives the literacy rate (in percentage) of 35 cities. Find the mean literacy rate. Literacy rate (in %) 45-55 55-65 65-75 75-85 85-98 Number of cities 3 10 11 8 3
Solution: Find the midpoint of the given interval using the formula. Midpoint (xi) = (upper limit + lower limit)/2 In this case, the value of mid-point (xi) is very large, so let us assume the mean value, A = 70 and class interval is h = 10. So, ui= (xi-A)/h = ui= (xi-70)/10 Substitute and find the values as follows: Class Interval Frequency (fi) (xi) di=xi– a ui= di/h fiui 45-55 3 50 -20 -2 -6 55-65 10 60 -10 -1 -10 65-75 11 70 0 0 0 75-85 8 80 10 1 8 85-95 3 90 20 2 6
Sumfi= 35
Sumfiui = -2 So, Mean = x̄ = A+(∑fiui/∑fi)×h = 70+(-2/35)×10 = 69.42 Therefore, the mean literacy part = 69.42
Exercise 14.2
1. The following table shows the ages of the patients admitted in a hospital during a year: Age (in years) 5-15 15-25 25-35 35-45 45-55 55-65 Number of patients 6 11 21 23 14 5 Find the mode and the mean of the data given above. Compare and interpret the two measures of central tendency.
Solution: To find out the modal class, let us the consider the class interval with high frequency Here, the greatest frequency = 23, so the modal class = 35 – 45, l = 35, class width (h) = 10, fm= 23, f1= 21 and f2= 14 The formula to find the mode is Mode= l+ [(fm-f1)/(2fm-f1-f2)]×h Substitute the values in the formula, we get Mode = 35+[(23-21)/(46-21-14)]×10 Mode = 35+(20/11) = 35+1.8 Mode = 36.8 year So the mode of the given data = 36.8 year Calculation of Mean: First find the midpoint using the formula, xi= (upper limit +lower limit)/2 Class Interval Frequency (fi) Mid-point (xi) fixi 5-15 6 10 60 15-25 11 20 220 25-35 21 30 630 35-45 23 40 920 45-55 14 50 700 55-65 5 60 300
Sumfi= 80
Sumfixi= 2830 The mean formula is Mean = x̄ = ∑fixi/∑fi = 2830/80 = 35.37 years Therefore, the mean of the given data = 35.37 years
2. The following data gives the information on the observed lifetimes (in hours) of 225 electrical components: Lifetime (in hours) 0-20 20-40 40-60 60-80 80-100 100-120 Frequency 10 35 52 61 38 29 Determine the modal lifetimes of the components.
Solution: From the given data the modal class is 60–80. l = 60, The frequencies are: fm= 61, f1= 52, f2= 38 and h = 20 The formula to find the mode is Mode= l+ [(fm-f1)/(2fm-f1-f2)]×h Substitute the values in the formula, we get Mode =60+[(61-52)/(122-52-38)]×20 Mode = 60+((9 x 20)/32) Mode = 60+(45/8) = 60+ 5.625 Therefore, modal lifetime of the components = 65.625 hours.
3. The following data gives the distribution of total monthly household expenditure of 200 families of a village. Find the modal monthly expenditure of the families. Also, find the mean monthly expenditure: Expenditure Number of families 1000-1500 24 1500-2000 40 2000-2500 33 2500-3000 28 3000-3500 30 3500-4000 22 4000-4500 16 4500-5000 7
Solution: Given data: Modal class = 1500-2000, l= 1500, Frequencies: fm= 40 f1= 24, f2= 33 and h = 500 Mode formula: Mode= l+ [(fm-f1)/(2fm-f1-f2)]×h Substitute the values in the formula, we get Mode =1500+[(40-24)/(80-24-33)]×500 Mode = 1500+((16×500)/23) Mode = 1500+(8000/23) = 1500 + 347.83 Therefore, modal monthly expenditure of the families = Rupees 1847.83 Calculation for mean: First find the midpoint using the formula, xi=(upper limit +lower limit)/2 Let us assume a mean, A be 2750 Class Interval fi xi di = xi – a ui = di/h fiui 1000-1500 24 1250 -1500 -3 -72 1500-2000 40 1750 -1000 -2 -80 2000-2500 33 2250 -500 -1 -33 2500-3000 28 2750 0 0 0 3000-3500 30 3250 500 1 30 3500-4000 22 3750 1000 2 44 4000-4500 16 4250 1500 3 48 4500-5000 7 4750 2000 4 28
fi = 200
fiui = -35 The formula to calculate the mean, Mean = x̄ = a +(∑fiui/∑fi)×h Substitute the values in the given formula = 2750+(-35/200)×500 = 2750-87.50 = 2662.50 So, the mean monthly expenditure of the families = Rupees 2662.50
4. The following distribution gives the state-wise teacher-student ratio in higher secondary schools of India. Find the mode and mean of this data. Interpret the two measures No of Students per teacher Number of states / U.T 15-20 3 20-25 8 25-30 9 30-35 10 35-40 3 40-45 0 45-50 0 50-55 2
Solution: Given data: Modal class = 30 – 35, l= 30, Class width (h) = 5, fm= 10, f1= 9 and f2= 3 Mode Formula: Mode= l+ [(fm-f1)/(2fm-f1-f2)]×h Substitute the values in the given formula Mode = 30+((10-9)/(20-9-3))×5 Mode = 30+(5/8) = 30+0.625 Mode = 30.625 Therefore, the mode of the given data = 30.625 Calculation of mean: Find the midpoint using the formula, xi=(upper limit +lower limit)/2 Class Interval Frequency (fi) Mid-point (xi) fixi 15-20 3 17.5 52.5 20-25 8 22.5 180.0 25-30 9 27.5 247.5 30-35 10 32.5 325.0 35-40 3 37.5 112.5 40-45 0 42.5 0 45-50 0 47.5 0 50-55 2 52.5 105.5
Sumfi= 35
Sumfixi= 1022.5 Mean = x̄ = ∑fixi/∑fi = 1022.5/35 = 29.2 Therefore, mean = 29.2
5. The given distribution shows the number of runs scored by some top batsmenof the world in one- day international cricket matches. Run Scored Number of Batsman 3000-4000 4 4000-5000 18 5000-6000 9 6000-7000 7 7000-8000 6 8000-9000 3 9000-10000 1 10000-11000 1 Find the mode of the data.
Solution: Given data: Modal class = 4000 – 5000, l = 4000, class width (h) = 1000, fm= 18, f1= 4 and f2= 9 Mode Formula: Mode= l+ [(fm-f1)/(2fm-f1-f2)]×h Substitute the values Mode = 4000+((18-4)/(36-4-9))×1000 Mode = 4000+(14000/23) = 4000+608.695 Mode = 4608.695 Mode = 4608.7 (approximately) Thus, the mode of the given data is 4608.7 runs
6. A student noted the number of cars passing through a spot on a road for 100 periods each of3 minutes and summarized it in the table given below. Find the mode of the data: Number of cars Frequency 0-10 7 10-20 14 20-30 13 30-40 12 40-50 20 50-60 11 60-70 15 70-80 8
Solution: Given Data: Modal class = 40 – 50, l = 40, Class width (h) = 10, fm= 20, f1= 12 and f2= 11 Mode= l+ [(fm-f1)/(2fm-f1-f2)]×h Substitute the values Mode = 40+((20-12)/(40-12-11))×10 Mode = 40 + (80/17) = 40 + 4.7 = 44.7 Thus, the mode of the given data is 44.7 cars
Exercise 14.3
1. The following frequency distribution gives the monthly consumption of an electricity of 68 consumers in a locality. Find the median, mean and mode of the data and compare them. Monthly consumption(in units) No. of customers 65-85 4 85-105 5 105-125 13 125-145 20 145-165 14 165-185 8 185-205 4
Solution: Find the cumulative frequency of the given data as follows: Class Interval Frequency Cumulative frequency 65-85 4 4 85-105 5 9 105-125 13 22 125-145 20 42 145-165 14 56 165-185 8 64 185-205 4 68
N=68
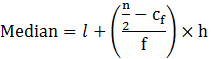
From the table, it is observed that, n = 68 and hencen/2=34 Hence, the median class is 125-145 with cumulative frequency = 42 Where,l= 125, n = 68, Cf= 22, f = 20, h = 20 Median is calculated as follows:
=125+((34−22)/20) × 20 =125+12 = 137 Therefore, median = 137 To calculate the mode: Modal class = 125-145, f1=20, f0=13, f2=14& h = 20 Mode formula: Mode= l+ [(f1-f0)/(2f1-f0-f2)]×h Mode = 125 + ((20-13)/(40-13-14))×20 =125+(140/13) =125+10.77 =135.77 Therefore, mode = 135.77 Calculate the Mean: Class Interval fi xi di=xi-a ui=di/h fiui 65-85 4 75 -60 -3 -12 85-105 5 95 -40 -2 -10 105-125 13 115 -20 -1 -13 125-145 20 135 0 0 0 145-165 14 155 20 1 14 165-185 8 175 40 2 16 185-205 4 195 60 3 12
Sumfi= 68
Sumfiui= 7 x̄ =a+h ∑fiui/∑fi=135+20(7/68) Mean=137.05 In this case, mean, median and mode are more/less equal in this distribution.
2. If the median of a distribution given below is 28.5 then, find the value of x & y. Class Interval Frequency 0-10 5 10-20 x 20-30 20 30-40 15 40-50 y 50-60 5 Total 60
Solution: Given data, n = 60 Median of the given data = 28.5 Where, n/2= 30 Median class is 20 – 30 with a cumulative frequency = 25+x Lower limit of median class,l= 20, Cf= 5+x, f = 20 & h = 10
Substitute the values 28.5=20+((30−5−x)/20) × 10 8.5 = (25 – x)/2 17 = 25-x Therefore, x =8 Now, from cumulative frequency, we can identify the value of x + y as follows: Since, 60=5+20+15+5+x+y Now, substitute the value of x, to find y 60 = 5+20+15+5+8+y y = 60-53 y = 7 Therefore, the value of x = 8 and y = 7.
3. The Life insurance agent found the following data for the distribution of ages of 100 policy holders. Calculate the median age, if policies are given only to thepersons whose age is 18 years onwards but less than the 60 years. Age (in years) Number of policy holder Below 20 2 Below 25 6 Below 30 24 Below 35 45 Below 40 78 Below 45 89 Below 50 92 Below 55 98 Below 60 100
Solution: Class interval Frequency Cumulative frequency 15-20 2 2 20-25 4 6 25-30 18 24 30-35 21 45 35-40 33 78 40-45 11 89 45-50 3 92 50-55 6 98 55-60 2 100 Given data: n = 100 andn/2= 50 Median class = 35-45 Then,l= 35, cf= 45, f = 33 & h = 5
Median = 35+((50-45)/33) × 5 = 35 + (5/33)5 = 35.75 Therefore, the median age = 35.75 years.
4. The lengths of 40 leaves in a plant are measured correctly to the nearest millimeter, and the data obtained is represented as in the following table: Length (in mm) Number of leaves 118-126 3 127-135 5 136-144 9 145-153 12 154-162 5 163-171 4 172-180 2 Find the median length of leaves.
Solution: Since the data are not continuous reduce 0.5 in the lower limit and add 0.5 in the upper limit. Class Interval Frequency Cumulative frequency 117.5-126.5 3 3 126.5-135.5 5 8 135.5-144.5 9 17 144.5-153.5 12 29 153.5-162.5 5 34 162.5-171.5 4 38 171.5-180.5 2 40 So, the data obtained are: n = 40 andn/2= 20 Median class = 144.5-153.5 then,l= 144.5, cf = 17, f = 12 & h = 9
Median = 144.5+((20-17)/12)×9 = 144.5+(9/4) = 146.75mm Therefore, the median length of the leaves = 146.75 mm.
5. The following table gives the distribution of a life time of 400 neon lamps. Lifetime (in hours) Number of lamps 1500-2000 14 2000-2500 56 2500-3000 60 3000-3500 86 3500-4000 74 4000-4500 62 4500-5000 48 Find the median lifetime of a lamp.
Solution: Class Interval Frequency Cumulative 1500-2000 14 14 2000-2500 56 70 2500-3000 60 130 3000-3500 86 216 3500-4000 74 290 4000-4500 62 352 4500-5000 48 400 Data: n = 400 &n/2= 200 Median class = 3000 – 3500 Therefore,l= 3000, Cf= 130, f = 86 & h = 500
Median = 3000 + ((200-130)/86) × 500 = 3000 + (35000/86) = 3000 + 406.97 = 3406.97 Therefore, the median life time of the lamps = 3406.97 hours
6. In this 100 surnames were randomly picked up from a local telephone directory and the frequency distribution of the number of letters in English alphabets in the surnames was obtained as follows: Number of letters 1-4 4-7 7-10 10-13 13-16 16-19 Number of surnames 6 30 40 16 4 4 Determine the number of median letters in the surnames. Find the number of mean letters in the surnames and also, find the size of modal in the surnames. Solution: To calculate median: Class Interval Frequency Cumulative Frequency 1-4 6 6 4-7 30 36 7-10 40 76 10-13 16 92 13-16 4 96 16-19 4 100 Given: n = 100 &n/2= 50 Median class = 7-10 Therefore,l= 7, Cf= 36, f = 40 & h = 3
Median = 7+((50-36)/40) × 3 Median = 7+42/40 Median=8.05 Calculate the Mode: Modal class = 7-10, Where,l= 7, f1= 40, f0= 30, f2= 16 & h = 3

Mode = 7+((40-30)/(2×40-30-16)) × 3 = 7+(30/34) = 7.88 Therefore mode = 7.88 Calculate the Mean: Class Interval fi xi fixi 1-4 6 2.5 15 4-7 30 5.5 165 7-10 40 8.5 340 10-13 16 11.5 184 13-16 4 14.5 51 16-19 4 17.5 70
Sum fi= 100
Sum fixi= 825 Mean = x̄ = ∑fixi/∑fi Mean = 825/100 = 8.25 Therefore, mean = 8.25
7. The distributions of below give a weight of 30 students of a class. Find the median weight of a student. Weight(in kg) 40-45 45-50 50-55 55-60 60-65 65-70 70-75 Number of students 2 3 8 6 6 3 2
Solution: Class Interval Frequency Cumulative frequency 40-45 2 2 45-50 3 5 50-55 8 13 55-60 6 19 60-65 6 25 65-70 3 28 70-75 2 30 Given: n = 30 andn/2= 15 Median class = 55-60 l = 55, Cf= 13, f = 6 & h = 5
Median = 55+((15-13)/6)×5 Median=55 + (10/6) = 55+1.666 Median =56.67 Therefore, the median weight of the students = 56.67
Exercise 14.4
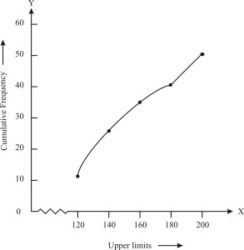
1. The following distribution gives the daily income of 50 workers if a factory. Convert the distribution above to a less than type cumulative frequency distribution and draw its ogive. Daily income in Rupees 100-120 120-140 140-160 160-180 180-200 Number of workers 12 14 8 6 10
Solution Convert the given distribution table to a less than type cumulative frequency distribution, and we get Daily income Frequency Cumulative Frequency Less than 120 12 12 Less than 140 14 26 Less than 160 8 34 Less than 180 6 40 Less than 200 10 50 From the table plot the points corresponding to the ordered pairs such as (120, 12), (140, 26), (160, 34), (180, 40) and (200, 50)on graph paper and the plotted points are joined to get a smooth curve and the obtained curve is known as less than type ogive curve
2.During the medical check-up of 35 students of a class, their weights were recorded asfollows: Weight in kg Number of students Less than 38 0 Less than 40 3 Less than 42 5 Less than 44 9 Less than 46 14 Less than 48 28 Less than 50 32 Less than 52 35 Draw a less than type ogive for the given data. Hence obtain the median weight from the graph and verifythe result by using the formula.
Solution: From the given data, to represent the table in the form of graph, choose the upper limits of the class intervals are in x-axis and frequencies on y-axis by choosing the convenient scale. Now plot the points corresponding to the ordered pairs given by (38, 0), (40, 3), (42, 5), (44, 9),(46, 14), (48, 28), (50, 32) and (52, 35)on a graph paper an join them to get a smooth curve. The curve obtained is known as less than type ogive.
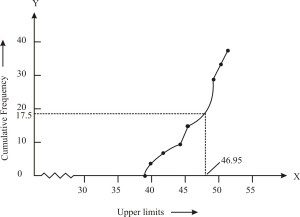
Locate the point 17.5 on the y-axis and draw a line parallelto the x-axis cutting the curve at a point. From the point, draw a perpendicular line to the x-axis. The intersection point perpendicular to x-axis is the median of the given data. Now, to find the mode by making a table. Class interval Number of students(Frequency) Cumulative Frequency Less than 38 0 0 Less than 40 3-0=3 3 Less than 42 5-3=2 5 Less than 44 9-5=4 9 Less than 46 14-9=5 14 Less than 48 28-14=14 28 Less than 50 32-28=4 32 Less than 52 35-22=3 35 The class 46 – 48 has the maximum frequency, therefore, this is modal class Here,l= 46, h = 2,f1= 14,f0= 5 andf2= 4 The mode formula is given as: Now, Mode =

= 46 + 0.95 = 46.95 Thus, mode is verified.
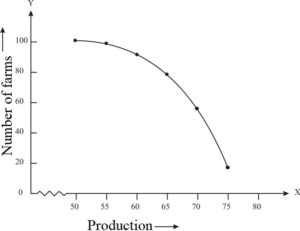
3. The following tables gives production yield per hectare of wheat of 100 farms of a village. Production Yield 50-55 55-60 60-65 65-70 70-75 75-80 Number of farms 2 8 12 24 38 16 Change the distribution to a more than type distribution and draw its ogive.
Solution: Converting the given distribution to a more than type distribution, we get Production Yield (kg/ha) Number of farms More than or equal to 50 100 More than or equal to 55 100-2 = 98 More than or equal to 60 98-8= 90 More than or equal to 65 90-12=78 More than or equal to 70 78-24=54 More than or equal to 75 54-38 =16 From the table obtained draw the ogive by plotting the corresponding points where the upper limits in x-axis and the frequencies obtained in the y-axis are (50, 100), (55, 98), (60, 90), (65, 78), (70, 54) and (75, 16) on this graph paper. The graph obtained is known as more than type ogive curve.