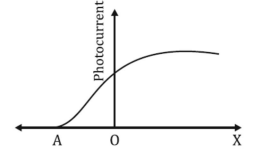
The graph shows the variation of photocurrent for a photosensitive metal
Komal Kohli February 15, 2023
Question 15:The graph shows the variation of photocurrent for a photosensitive metal
(a)What does X and A on the horizontal axis represent?
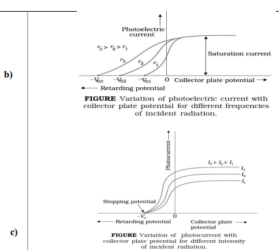
(b)Draw this graph for three different values of frequencies of incident
radiation ʋ1, ʋ 2 and ʋ 3 (ʋ 3>ʋ 2>ʋ1) for the same intensity.
(c) Draw this graph for three different values of intensities of incident
radiation I1, I2 and I3 (I3> I2>I1) having the same frequency.
The correct answer is -a)A - cut off or stopping potential
X - anode potential