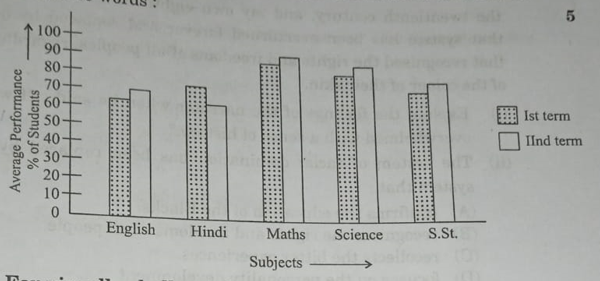
The bar graph illustrates a comparative analysis of students' performance in different subjects during the terminal exam. It vividly depicts variations in the students' achievements across subjects. Mathematics emerges as the top-performing subject, with the highest average score among students. Conversely, English lags behind with the lowest average score, indicating potential challenges or areas needing improvement in language proficiency. Science and Social Studies fall in between, showing moderate performance levels. The variations in students' performances across subjects may reflect differing levels of interest, aptitude, and teaching methodologies. It highlights the need for targeted interventions and instructional strategies to enhance student engagement and comprehension, particularly in subjects where performance is comparatively lower. This data serves as valuable feedback for educators to tailor their teaching approaches and provide additional support where necessary, fostering holistic academic development among students.